Plot RMSIP Results
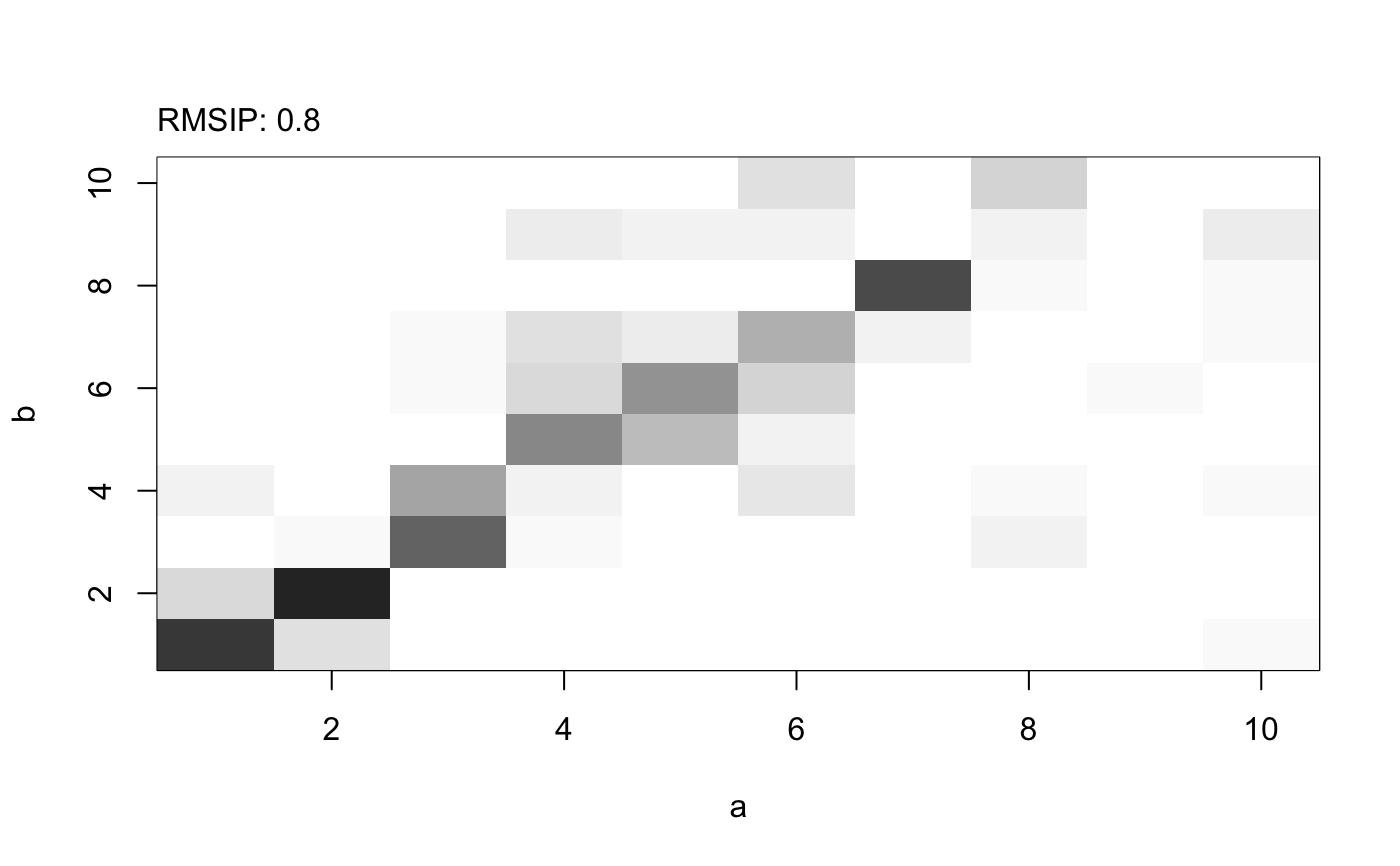
plot.rmsip.RdProduces a heat plot of RMSIP (Root mean square inner product) for the visualization of modes similarity.
# S3 method for rmsip
plot(x, xlab = NULL, ylab = NULL, col = gray(50:0/50),
      zlim=c(0,1), ...)
Arguments
| x | an object of class |
|---|---|
| xlab | a label for the x axis, defaults to ‘a’. |
| ylab | a label for the y axis, defaults to ‘b’. |
| col | a vector of colors for the RMSIP map (or overlap values). |
| zlim | the minimum and maximum ‘z’ values for which colors should be plotted. |
| ... | additional arguments to function |
Details
plot.rmsip produces a color image with the function
image.
Value
Called for its effect.
References
Grant, B.J. et al. (2006) Bioinformatics 22, 2695--2696.
Author
Lars Skjaerven
See also
rmsip, overlap,
nma, image.
Examples
## Read PDB structure pdb <- read.pdb( system.file("examples/1hel.pdb", package="bio3d") ) ## Perform NMA modes.a <- nma(pdb, ff="calpha")#> Building Hessian... Done in 0.012 seconds. #> Diagonalizing Hessian... Done in 0.079 seconds.modes.b <- nma(pdb, ff="anm")#> Building Hessian... Done in 0.01 seconds. #> Diagonalizing Hessian... Done in 0.076 seconds.
