Percent Identity
seqidentity.RdDetermine the percent identity scores for aligned sequences.
seqidentity(alignment, normalize=TRUE, similarity=FALSE, ncore=1, nseg.scale=1)
Arguments
| alignment | sequence alignment obtained from
|
|---|---|
| normalize | logical, if TRUE output is normalized to values between 0 and 1 otherwise percent identity is returned. |
| similarity | logical, if TRUE sequence similarity is calculated instead of identity. |
| ncore | number of CPU cores used to do the calculation.
|
| nseg.scale | split input data into specified number of segments
prior to running multiple core calculation. See |
Details
The percent identity value is a single numeric score determined for each pair of aligned sequences. It measures the number of identical residues (“matches”) in relation to the length of the alignment.
Value
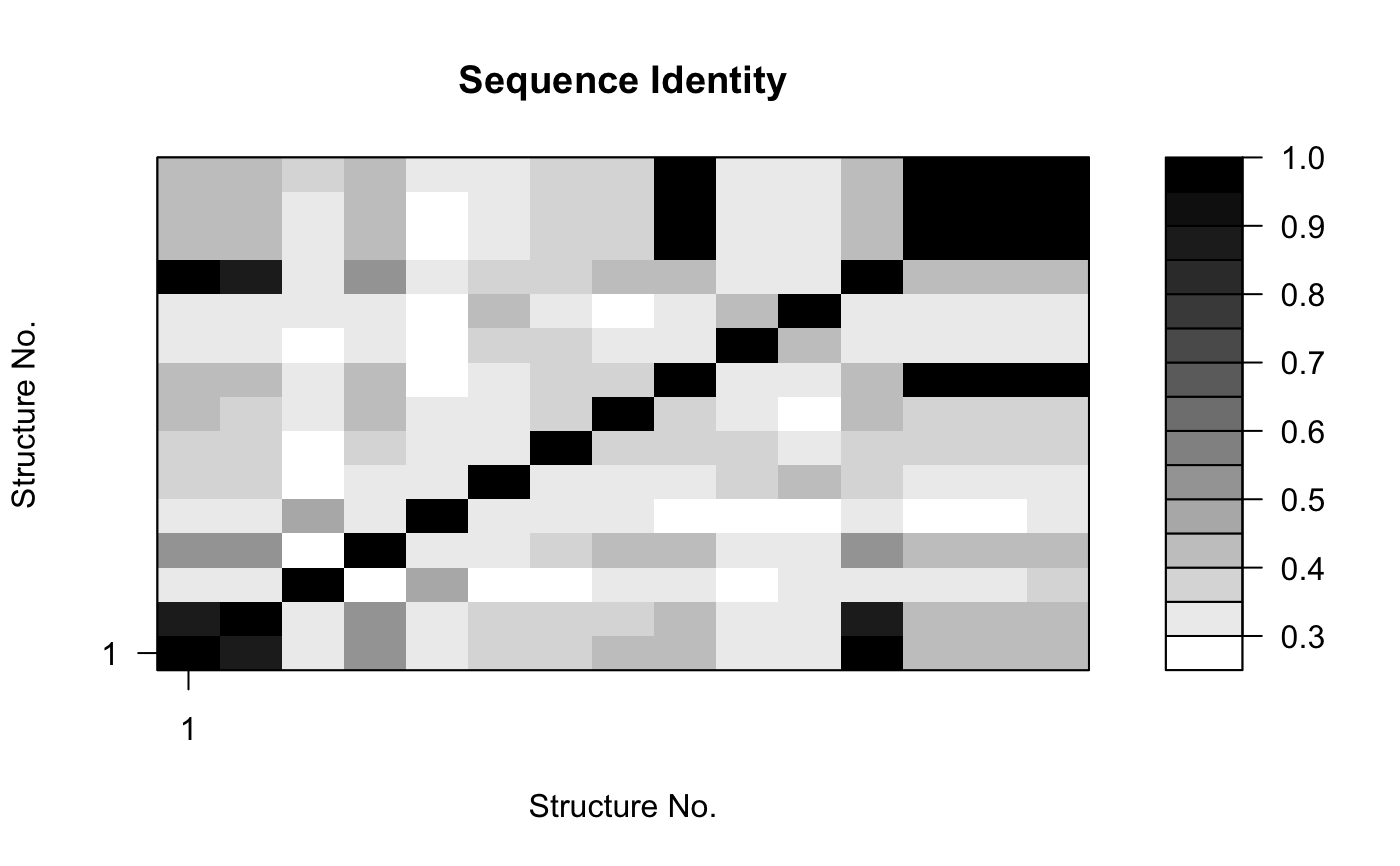
Returns a numeric matrix with all pairwise identity values.
References
Grant, B.J. et al. (2006) Bioinformatics 22, 2695--2696.
Author
Barry Grant
See also
read.fasta, filter.identity,
entropy, consensus
Examples
attach(kinesin) ide.mat <- seqidentity(pdbs) # Plot identity matrix plot.dmat(ide.mat, color.palette=mono.colors, main="Sequence Identity", xlab="Structure No.", ylab="Structure No.")# Histogram of pairwise identity values hist(ide.mat[upper.tri(ide.mat)], breaks=30,xlim=c(0,1), main="Sequence Identity", xlab="Identity")#> [,1] [,2] #> [1,] 1.000 0.461 #> [2,] 0.461 1.000detach(kinesin)

